The Basic and Advanced Calculations packages in TapReports and TapAnalytics bring great value to marketers trying to get command of their data. In this post we’ll talk about some of the basic KPIs which are easily computed in the Tap platform, and how they help reveal valuable insights as to campaign performance.

How to Calculate an Average
Averages across any of your KPIs help marketers simplify the vast amount of data that they have at their fingertips. With an average, you can get a general idea of how your campaigns are performing and quickly uncover trends to set goals and allocate budgets.
Let's get mathematical. To calculate the average of anything, all you have to do is add up all of the numbers that you are including in your calculation. Then, you divide them by how many numbers there are. Finding the mean is just the sum divided by the count.
While calculating the average is simple enough, the marketers often don't have the time to pull out a calculator and manually find the average. Thankfully, powerful marketing data analytics programs will do the math for you. This way, you can simply click a button to understand important marketing insights, like averages for:
- Customer value
- Spend on routine tasks
- Advertising spend
- Cost per click
- Sales price
- Life cycle of a new customer
- And the list goes on…
To help guide you, here is how to find the average of helpful common metrics in some of the most common data analytics programs that marketers use.
How to find Average Monthly Visitors in Google Analytics 4
Here’s how to calculate "Average Monthly Visitors" in Google Analytics 4 (GA4). Just follow these 4 easy steps:
- Access Reports:
First, login to your Google Analytics 4 account
Next, navigate to the "Reports" section on the left-hand side menu; - Select Time Period:
On the top right, select a time period that covers the months you have in mind, for example the last 6 months or last 12 months. Longer time periods will give you a better sense of how the average is trending; - Choose the Right Metric:
In GA4, "Visitors" is generally represented by "Active Users" or "Users" depending on the value you're looking for (e.g., total users, unique users…).
In the report, make sure you're using the "Users" or "Active Users" metric; - Calculate the Monthly Average:
Once you’ve got the total number of users for the desired period, divide that number by the number of months in your desired period.
For example, if you selected a 12-month period and GA4 shows 120,000 users, your average monthly visitors would be: Average Monthly Visitors = 120,000 users / 12 months = 10,000 users per month.
Finally, you can create a Custom Report (Optional):
Yes, you can create a custom report easily in GA4, which will automatically calculate the monthly average if you need to access this data often.
To make this process a bit easier, consider using a data analytics tool, like TapClicks, where you can create a different dashboard for each quarter (e.g. “1Q24 Dashboard, 2Q24 dashboard, etc.). Or, you can just filter by time periods, like you can do on any suitable Dashboard that you create in TapAnalytics:
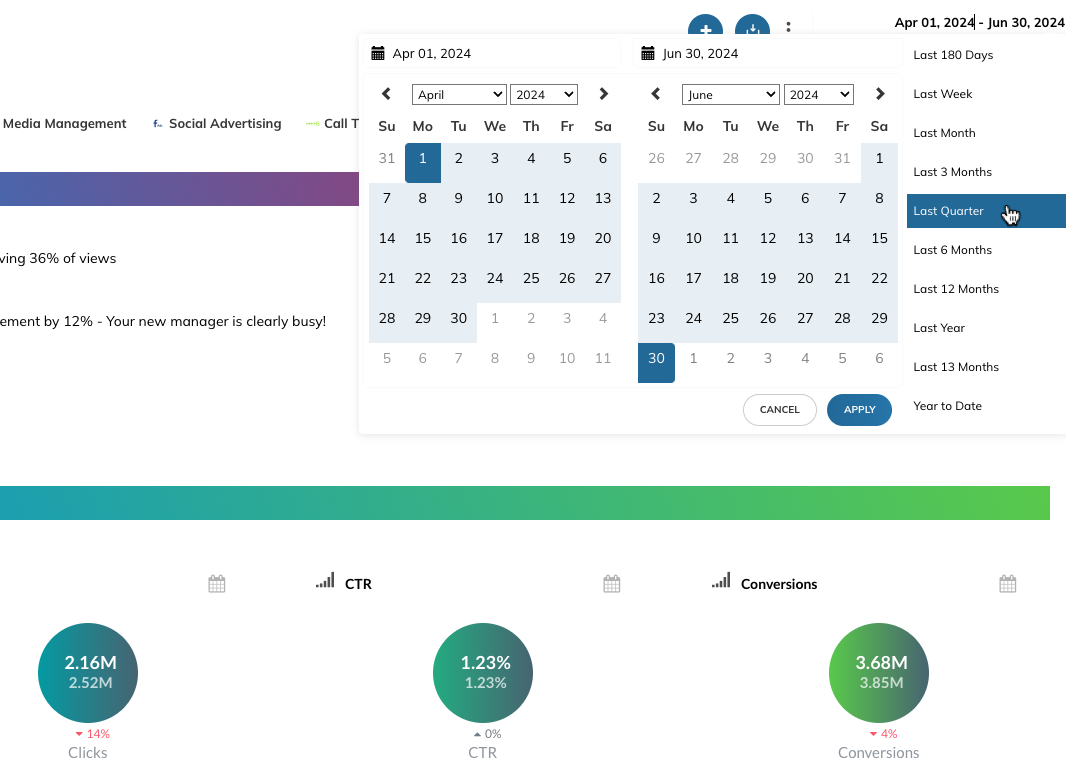
Then, you can use a metric like average daily unique visitors and/or average monthly unique visitors. Then, you can compare data from Q1 and Q2, respectively, to monitor growth.
Much easier than pulling out the calculator!
How to Calculate the Average Cost Per Click
Average Cost-per-Click (CPC) is another common metric for marketers. You can calculate this by adding up your actual costs-per-click and dividing it by the number of clicks you get. For example, if one click cost .10 and another cost .30 and you divide that by 2, the average CPC is .20.
Again, all that math can be a pain. Instead, you can find your average CPC amounts in the average CPC column on your Campaigns tab in Google Ads.
This tab is also a metric you can include in any top-of-the-line marketing analytics dashboards.
How to Calculate the Average Session Duration
Average session duration is a KPI that most analytics programs offer in the standard dashboard. For example, if you head to your Google Analytics account, you can click on Audience, and Overview. Right in the dashboard, you can see the average session duration:
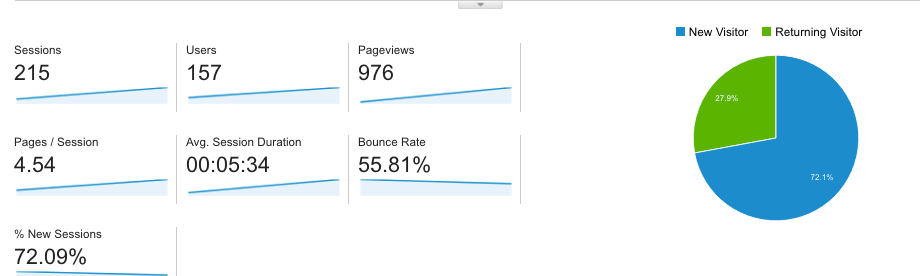
What's significant about a marketing analytics dashboard is that you can see all of your average session durations for all important platforms in one location.
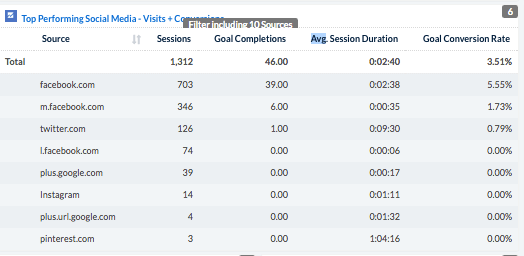
In TapClicks, for example, you can see information about all your top-performing social media accounts. This information is in one location. When you view the average session duration data, you can see which platform is holding your customers' attention the longest.
Finding the Average with the Calculations tool in TapClicks
Throughout this article, we’ve given examples of how to find certain types of averages in different marketing platforms, but not every platform will have those averages as a metric. Instead of doing the math by hand, you can efficiently calculate averages in TapClicks with the Calculations feature.
To set this up in TapClicks, navigate to “Calculations” and click “Add New Calculation.” You’ll pick your data source such as Apple Search Ads or a Channel with combined data sources like all of your social channels. Then in the Calculation Builder, you’ll add the formula SUM / COUNT to find the average of any metric, such as clicks, impressions, or revenue. You can find averages to easily monitor important KPIs and include the calculated average on a dashboard along with all of your other metrics.
And there you have it! Calculating the average is an easy mathematical process. But, it's even easier when you use a marketing analytics dashboard platform. A marketing analytics dashboard will calculate and display the averages for you.
Schedule a Demo
.png)