
White-Label Reporting Dashboard: A Complete Guide
Everyone wants to look like a tech superstar in front of clients, but who has the time and resources to develop world-class tech? In this modern era, white-labeled products are the answer to that question.
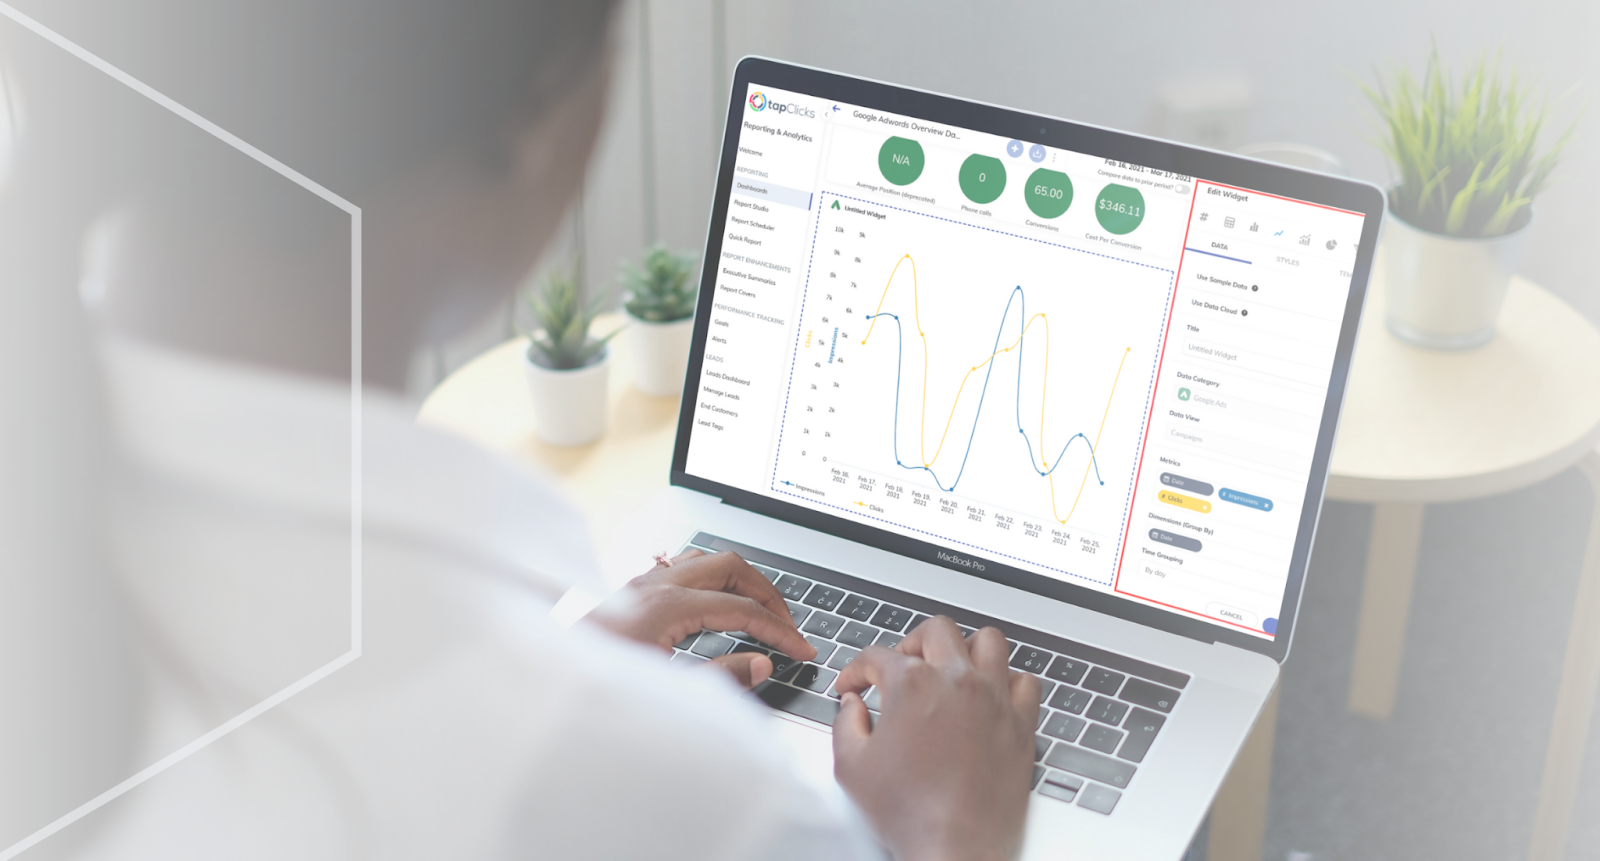
They let you present marketing performance, sales data, and customer insights in a fully branded dashboard without third-party logos getting in the way.
With a white-label solution, you can create custom reports, host dashboards on your own domain, and give clients a seamless experience that reinforces your brand. No complex development required—just clean, professional reporting that looks like it was built in-house.
In this post, we look at how you can use TapClicks world class reporting, dashboard and analytics to create 100% customizable white-label reports in three easy steps. This includes customizing your client reports and using advanced data calculation to show your clients how your marketing strategies bring their business value.
Start delivering branded reports with a seamless user experience today. Book a demo and get a white-label dashboard set up for you.
The Challenges of White-Label Reporting
Most white-label reporting tools focus on adding a client’s logo and maintaining brand consistency, but this alone does not improve marketing performance analysis.
A white-label reporting dashboard should include features that automate reporting, integrate data, and provide actionable insights.
Basic vs. Advanced White Label Reporting
Many white-label reporting tools focus on basic branding. This means you can only add a client’s logo and your own branding to reports. While this helps with brand consistency, it does little to improve marketing performance analysis.
The real value of a white-label reporting dashboard comes from advanced data calculations and integrations. You can use more advanced white-label analytics tools to:
-
Track regional ad impact: Analyze how TV and radio ads in specific locations affect website traffic and eCommerce sales.
-
Compare cross-platform campaigns: View Google Ads, Facebook Ads, and other platforms side by side in a single dashboard.
-
Create custom metrics: Merge raw data from multiple sources, such as social media engagement metrics across different channels.
Manual Data Integration
Performing these calculations manually is time-consuming. Without white-label dashboard software, you need to:
-
Export data from Google Ads, Facebook Ads, TV/radio platforms, and more.
-
Organize the data in Google Sheets or spreadsheets so the date ranges match.
-
Conduct data analysis to produce insights.
-
Build reports using PowerPoint or other tools, adding charts, graphs, and tables.
-
Send reports to multiple clients while maintaining brand consistency.
Many marketing agencies report that account managers spend an average of 12 hours per week on reporting processes. TapClicks makes this simple by:
-
Automatically pulling data from multiple platforms into a central dashboard.
-
Performing advanced calculations for comparisons, cost analysis, and engagement tracking.
-
Inserting real-time data into branded dashboards, PDFs, PowerPoints, and online reports.
-
Sending scheduled reports without manual input, reducing wasted time.
Recommended Reading
TapClicks Offers Leading HIPAA-Compliant Marketing Reporting and Workflow Solution
How to Set Up Insightful and Recurring White-Label Reports With TapClicks in 3 Steps
Creating branded reports manually takes time and effort, especially when pulling data from multiple data sources and organizing it for clients.
TapClicks automates this process, so you can generate reports, customize them with their branding, and send scheduled reports without manual work.
In just three steps, businesses can use TapClicks’ white-label reporting dashboard.
Step #1: Connect Your Data Sources
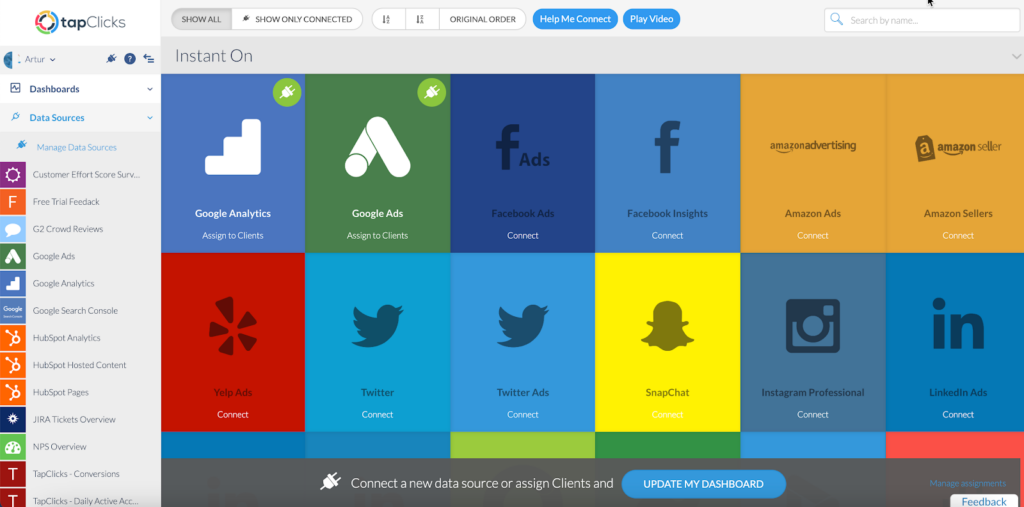
The first step is to bring all data sources into one place. Instead of manually pulling data from multiple platforms, you can automate data collection within a white-label dashboard.
TapClicks has Instant-On connectors for all leading marketing platforms (including Facebook Ads, Google Ads, and Linkedin Ads) and connectors for SEO tools, advertising analytics platforms, eCommerce tools, CRMs, and more.
Once connected, the data will automatically be pulled out of their native platforms and into your TapClicks reporting dashboard.
With TapClicks’ Instant-On connectors, you get:
-
Up to 12 months of historical data, depending on the connector. This allows you to retrieve a full year of past data when setting up a new client. It makes it easy to compare current performance with previous results.
-
No maintenance or API management is required. TapClicks handles all API updates to remove the need for developers to manage connections. If an API changes or breaks, TapClicks fixes it, preventing disruptions in client dashboards.
-
Permanent data storage for long-term analysis. Unlike reporting tools that only access live data, TapClicks permanently stores imported data. If a marketing platform has a 90-day lookback window or if a client leaves, you can still access past reports.
Using TapClicks’ white-label reporting software as a marketing data warehouse allows you to analyze long-term trends and create case studies showcasing their success.
For example, an agency working with eCommerce brands can store website traffic, ad engagement, and conversion data. You can use it to demonstrate the impact of TV and radio ads on online sales.
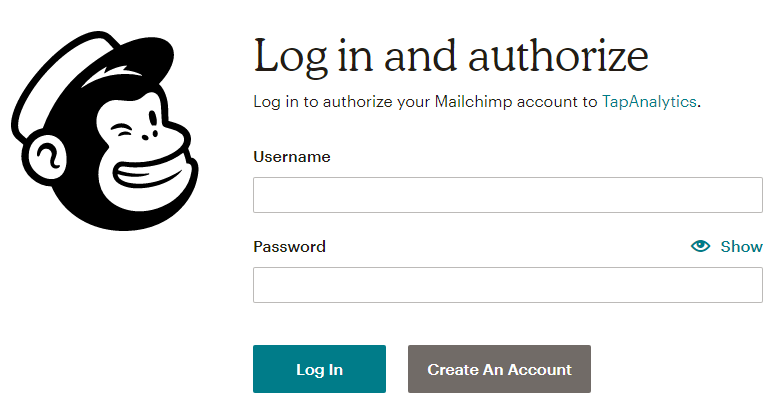
Smart Connector for Virtually Any Other Data Source
If a platform doesn’t have an Instant-On Connector, TapClicks’ Smart Connector allows you to integrate your own data or connect external sources directly into your TapClicks account.
Here's a quick video breakdown of how to use the Smart Connector tool:
1 How to Create a Smart Connector
TapClicks offers one of the most comprehensive connector libraries for marketing, sales, eCommerce, and business platforms. If data exists, TapClicks will most likely connect to it.
With TapClicks, all marketing and sales data is centralized in one dashboard—no need to download spreadsheets, manually integrate data, or spend extra time building custom white-label reports.
Start delivering professional, data-driven reports without the extra effort. Try TapClick's 14-day trial today!
Step #2: Automate Key Calculations
Agencies track core metrics for client reports, such as ROAS comparisons between Facebook and Google Ads, often monthly or weekly.
Manually pulling data from multiple platforms, organizing it in spreadsheets, and performing calculations to generate visual reports takes time.
One of the biggest challenges in custom reporting is repeatedly calculating metrics and creating:
-
Graphs
-
Charts
-
Visual elements for each report
With TapClicks, these calculations are automated. You don't need manual data compilation to gather accurate, ready-to-use metrics for every report.
Key Calculations Marketing Teams Use to Demonstrate Value
Marketing agencies rely on data-driven calculations to measure performance and showcase results to clients. Some key examples include:
-
Cross-platform campaign comparisons: Evaluating ROAS across multiple advertising channels like Instagram Ads, LinkedIn Ads, Pinterest Ads, TV, podcasts, and radio to determine the most effective platforms.
-
Total cost analysis: Aggregating cost per engagement, customer acquisition cost, and cost per conversion across all campaigns to provide a complete cost breakdown.
-
Branding & engagement metrics: Measuring average comments and shares per post across multiple social media platforms to assess brand impact and audience interaction.
-
CTA performance evaluation: Analyzing conversion rates for different CTAs and landing page layouts to optimize for higher engagement.
By automating these calculations, agencies can save time, improve accuracy, and focus on delivering strategic insights to clients.
Update Reports And Metrics Across All Clients With TapClicks
When using TapClicks, there is no need to manually create custom dashboards for each client. Instead, you can build a single template and filter data by a client, allowing all custom data sets to be managed from one dashboard. This makes it quick and efficient to adjust key metrics across all clients.
For example, when generating Google Ads client reports, most white-label dashboard software requires separate dashboards for each client. This means any update—such as modifying impression tracking or adjusting ad spend grouping—has to be applied individually to every dashboard.
With TapClicks, a universal reporting dashboard template is used across all clients. Any edits made to the template instantly update all client dashboards.
This provides a consistent reporting experience while maintaining control over branding, customization, and data presentation—all hosted on their own domain for a seamless user experience.
TapClicks’ approach helps with:
-
Standardized reporting across all clients: You can make sure every client receives accurate reports that align with current strategies and performance data.
-
Increased efficiency for employees: You no longer need to spend hours on repetitive tasks, such as manually applying reporting updates across multiple client dashboards.
Recommended Reading
Life Before and After Social Media Dashboards (and Why 2060 Digital Has Never Looked Back)
Step 3: Create, Schedule, and Automate Your White Label Reports
Beyond live dashboard reports, TapClicks’ Report Studio automates the creation and delivery of recurring PDF, PowerPoint, and other client reports via email. Instead of manually assembling reports, agencies can set up automated templates that update with the latest data before being sent to clients.
Without automation, creating these reports involves multiple time-consuming steps:
-
Taking screenshots of data visuals
-
Pasting screenshots into marketing reports
-
Adding annotations or writing long explanations to provide context
-
Formatting reports according to client preferences (PDF, spreadsheet, PowerPoint, etc.)
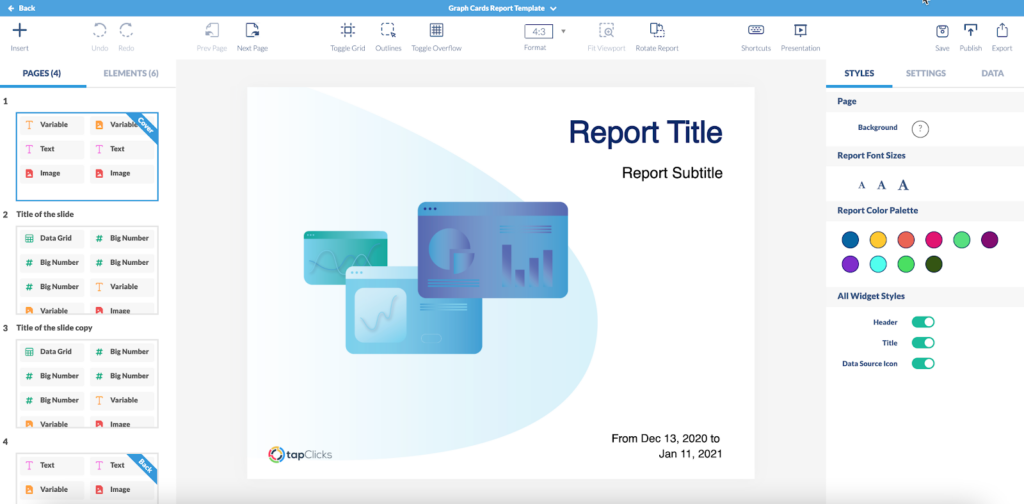
With TapClicks Report Studio, agencies can eliminate this manual process. Reports are built using widgets that automatically update with real-time data, ensuring accuracy.
Use the Report Studio to:
-
Create a report template: Design a fully branded PowerPoint or PDF that reflects the agency’s or client’s branding.
-
Add dynamic widgets: Insert charts, graphs, and data fields that automatically refresh before each scheduled report.
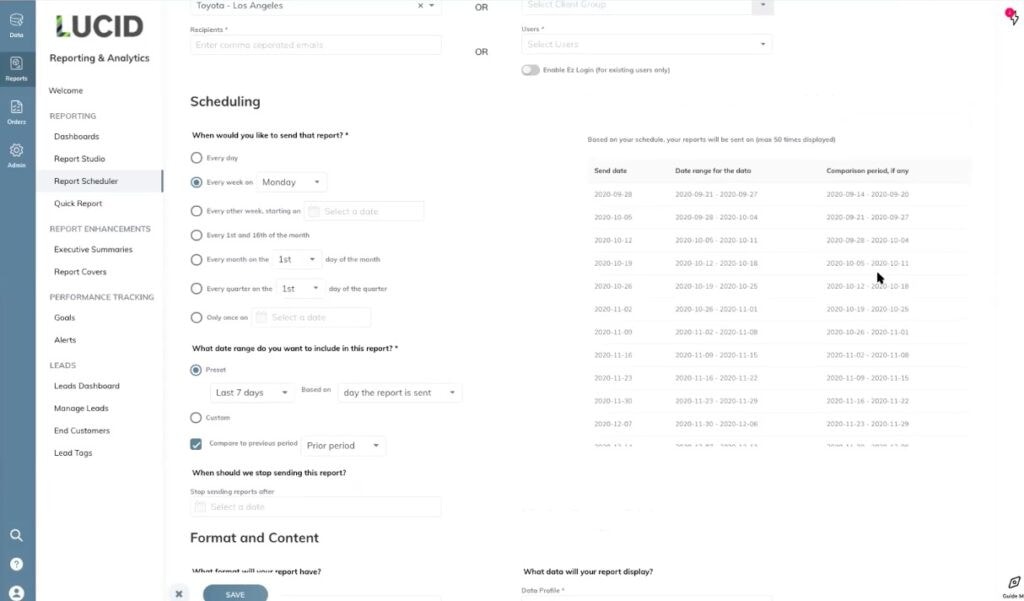
-
Schedule automated delivery: Set the report to be emailed at any preferred frequency (weekly, monthly, or custom).
This automation saves agencies significant time. Employees no longer need to spend hours manually building reports and can instead focus on data analysis and campaign optimization.
Take control of your reporting process and provide clients with customized, data-driven insights—without the manual work. Try TapClicks Free for 14 Days!
Create 100% Customized Client Reports With TapClicks
Delivering fully customized client reports no longer requires hours of manual work. TapClicks’ white-label reporting software automates data collection, report generation, and branding, allowing businesses to create professional, data-driven reports effortlessly.
With 250+ Instant-On connectors, you can pull data from Google Ads, Facebook Ads, CRMs, and eCommerce platforms, making sure every report is comprehensive and up to date.
Reports can be fully customized with logos, colors, and layouts and hosted on its own branded web app using its own domain, providing a seamless user experience for clients.
Instead of manually building reports every week or month, you can use TapClicks’ automated reporting tools to generate PowerPoint, PDF, and live dashboard reports that automatically update with real-time data.
Try TapClicks free for 14 days and start creating 100% customized client reports today! Sign up now.
FAQs About White-Label Reporting Dashboard
What is a white-label dashboard?
White-label analytics dashboards are custom-branded reporting platforms that allow businesses to present data insights under their own branding without third-party logos. It helps agencies and businesses provide clients with a seamless user experience by hosting reports on their own domain and customizing dashboards to match their brand identity.
What is a white-label report?
A white label report is a customized report that includes a business’s branding, logos, and color scheme instead of the software provider’s branding. It is commonly used by marketing agencies, SaaS companies, and consultants to deliver professional reports without revealing the reporting tool used to generate them.
What is a reporting dashboard?
A reporting dashboard is a visual interface that displays real-time data from multiple sources in one place. It helps businesses track marketing performance, sales data, and key metrics through charts, graphs, and tables. Automated dashboards eliminate the need for manual reporting by continuously pulling in updated data.
What is a white-label panel?
A white label panel refers to a fully branded, customizable dashboard that businesses can use to provide services or reports under their own name. It allows companies to maintain brand consistency while offering clients a professional reporting experience without third-party branding.
How does TapClicks simplify white-label reporting?
TapClicks automates the entire reporting process, integrating data from 250+ platforms into a single white-label dashboard. Businesses can create branded reports, schedule automated updates, and host client dashboards on their own domain, saving time and ensuring consistent, professional reporting.