
When you think about marketing reporting, you probably aren't imagining anything you'll enjoy.
End-of-month, end-of-quarter, and end-of-year meetings to discuss marketing metrics aren't exactly a thrill ride. But they're a necessary part of doing business. They're also an integral step you must take to inform your strategy in the coming months and years.
But when you provide marketing services to other businesses, marketing reporting becomes even more essential. You need quantitative data to fine-tune your clients' strategies. Furthermore, your entire business is dependent upon proving a return on your clients' investment.
In other words, without comprehensive reporting, you have no way to justify your existence.
Unfortunately, not all marketers are taking advantage of their reporting tools. Many more marketers struggle to produce reporting at all.
Only 22% of marketers have data-driven initiatives that achieve significant results, and 74% of marketers can't even measure their marketing efforts.
In 2019, marketing service providers can't afford to ignore marketing metrics, analytics, and client reporting. Thankfully, there are a wealth of tools available that can help you automate reporting. You can even create visual reports to prove ROI to your clients.
Here's everything you need to know about client reporting for marketing.
What is Client Reporting?
First, let's get a better idea of what client reporting looks like.
Marketing reports should convey measurements of marketing KPIs in a way that is easy to read and comprehend. In most cases, you'll be delivering reports to decision-makers, CMOs, or some other type of liaison.
These reports could be long, written pieces about the prospect of entering a new market. Or, they could be short, visual representations of your client's latest campaign.
It all depends on your client's strategy and the size of your retainer. Your client could be relatively hands-off. But at some point, you are going to have to meet with your client to discuss results.
Regular Client Reporting Meetings
Most agencies sit down with their clients weekly, bi-weekly, or monthly for a short check-in about how their campaigns are progressing. They may have more extended strategy sessions after a reporting discussion.
Regardless of the context, keep in mind that your clients are strapped for time. They need something concrete to digest so they can understand how their marketing budget is contributing to their business success. They also need something substantive that they can share with other stakeholders.
More than anything, client reporting should convey how the marketing results you are producing will impact your clients' bottom line. It should serve as evidence of how hard you work and how much value you bring clients through their investment.
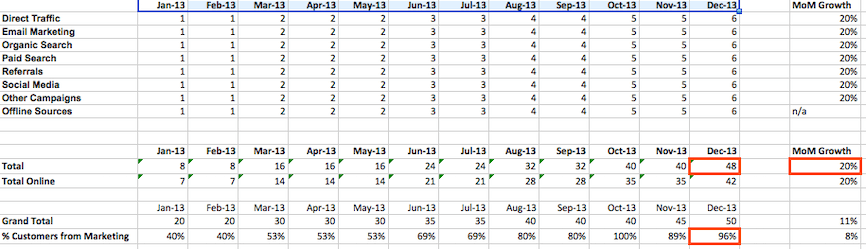
In the past, most marketers generated reports manually, often using spreadsheets, like this:
You can still use spreadsheets and Excel charts. But you don't have to generate reports manually. Using the right marketing reporting tools, you can generate engaging reports at regular intervals automatically.
All you must do to prep for a meeting is access the report.
Nonetheless, most clients will be unimpressed by a spreadsheet and a few basic charts. Spreadsheets also make it difficult for people to grasp complex data sets fully. If you're running multiple campaigns for a single client, they'll get confused looking at a wall of numbers.
Data Visualization
Consider using data visualization techniques to create compelling reports that are easy to understand and a pleasure to view. Sometimes referred to as DataViz, data visualization is a form of visual communication. It involves the visual representation of complex sets of data.
The technique was already being used widely in the sciences and humanities. But improvements in the accessibility of automation, data analytics, and graphics rendering have made data visualization more widely available to businesses and entrepreneurs.
As digital marketing has become more integrated and expansive, data visualization is becoming more necessary. Most businesses are marketing over multiple channels. They use disparate systems that don't always communicate.
Your client needs to understand how all their marketing systems work together to generate results. Visualizations can make that process easier.
As an example, here's a visualization CNN created representing the costs of renting housing in the U.S.:

(Source: money.cnn.com)
Visualizations can take any number of forms, even abstract ones. This graphic is a visualization of a network of nodes similar to a network of friends you might find on Facebook:

(Source: Wikipedia)
Of course, your marketing visualizations don't need to be overly complex. You also need to save space for the most important part of your report: the KPIs. Often, a simple set of graphs and charts will convey enough information to make your point.
Take this visualization of Facebook Ad data from the TapClicks dashboard, for example:

Or this visualization of Google Analytics data from the TapClicks dashboard:

With the right tools at your disposal, you can even create charts and visualizations using a combination of imported custom data. The best reporting tools can take inputs from both legacy systems and newer, automated systems.
What are Marketing Analytics and Metrics?
It's also important to understand the difference between metrics and analytics. While the two terms are related, they play different roles in reporting.
- Metrics are a standard of measurement. In marketing, metrics typically refers to a list of measurable values that demonstrate KPIs.
- Analytics refers to the analysis of metrics and KPIs. Analytics should help you answer specific questions. For example, if you want to know if you should invest more in PPC ads, check how your metrics from past months stacked up.
The right analytics tools can keep track of metrics, conduct analyses, and produce client reports. All client reporting should be based on data and analytics. Without concrete numbers, it's impossible to provide clients with actionable reports.
Why is Client Reporting So Important for Marketing?
Across the board, marketers consistently struggle to prove ROI to either their superiors or to their clients. Businesses tend to consider sales teams more integral to the health of a company than marketing teams.
That's because salespeople close deals. It's much easier to draw a correlation between revenue coming in and the sales team's close rate. It's much harder to draw a line from a marketing campaign directly to cash flow.
That doesn't mean marketing doesn't contribute to the bottom line. It just means marketing teams need to work extra hard to demonstrate their value. As a marketing service provider, you must work even harder to prove your worth. Otherwise, you risk losing your client to another agency.
Here are four key reasons you should invest in a robust client reporting system:
1. Reporting Increases Transparency Between You and Your Client
Nobody wants to be in the dark. Businesses that pay top dollar for marketing services are no exception.
Companies across the spectrum are trying to embrace transparency. This is, in part, a reaction to what's been going on in the news. In the tech world, giants like Facebook and Google have all come under fire for deceptive practices.
Consumers want transparency when it comes to the food they eat, the medications they take, and the cars they drive. Your clients want transparency when it comes to their marketing spend. When you provide clients with detailed marketing reports, they never have to worry about where their money is going and why.
Naturally, you won't always have good news for your clients. It can be challenging to report on strategies that aren't working. However, this is a perfect opportunity to embrace transparency.
If you follow up bad news with solutions, your clients will appreciate your honesty and sincerity. It can do wonders for your client relations and help you press forward.
2. Reporting Lets You Educate Your Client
Many businesses know they need marketing. Not every business understands how marketing works. Providing robust reporting in the form of data visualizations or a dashboard is an effective way to educate your client about your work.
When you present marketing reporting to your client, consider it an opportunity to show your expertise. Your insight can help them understand how their investment is contributing to their business.
3. Reporting Can Lead to Additional Business
On a similar note, consider client reporting an opportunity to gain additional business. Analyzing your client's marketing report can help you spot opportunities for growth. You can then relay those opportunities to your client and upsell them on additional services.
It's much easier to upsell an existing client than to convince a new client to buy. If you're like most business, about 80% of your future profits will come from just 20% of your existing customers.
4. Reporting Gives You a Reason to Touch Base
If too much time lapses between meetings, your clients may start to think you've forgotten about them. Keeping a regular reporting schedule gives you a reason to contact your clients, touch base, and discuss strategy. It also gives you an opportunity to remind them why they hired you.
Depending on your arrangement, you can have reporting meetings frequently or occasionally. Nonetheless, they should always be scheduled regularly, such as:
- Daily
- Weekly
- Bi-weekly
- Monthly
- Quarterly
- Yearly
You may wish to have a combination of different meetings to discuss short-term and long-term strategy.
Nonetheless, your client should always have access. With a marketing dashboard, you can give your clients 24/7 access to their marketing analytics. They simply log in and check on their campaigns.
Finally, touching base gives you the opportunity to discuss wins with your clients. Without your reports, they may not know when their marketing is producing results.
Stop Struggling with Your Client Reporting
If you're struggling to present comprehensive marketing reports to your clients, you may lack the right tools.
The TapClicks marketing reporting platform, TapReports, generates reports automatically. You can generate reports in any file type you prefer, including PPTX and PDF files.
But the most noteworthy aspect of TapClicks is its series of reporting dashboards. You can collaborate with your clients in real time using online dashboards and reports. There are dashboards for Google Ads, Twitter, Facebook, and other platforms.
If your client is operating on multiple platforms, you can combine them into a channel grouping. Channel grouping gives them a high-level view of how their marketing is working.
For example, advertisements on multiple social media platforms could be tracked and measured on a single channel: social media ads.
When you're presenting marketing reporting to your clients, don't treat it as business as usual. Treat it as an opportunity to blow them away with detailed reports, data visualizations, and comprehensive dashboards.
Try TapClicks free today to see how you can make your client reports shine.