When scaling a digital marketing agency, you'll eventually need to invest in marketing operations or performance management platforms to continue driving results for your clients. It doesn't take long in research mode to find many options on the market.
We understand it's challenging to sort through them and figure out which tools are right for your business. To help you decide, we've prepared an in-depth comparison of three performance management tools for marketing agencies: TapClicks, Domo, and Looker.
In this article, we cover the main features of each service, as well as critical differences between the platforms. We detail their particular features and make our recommendations throughout.
What Is TapClicks?
TapClicks is an all-in-one, enterprise-level performance management tool for marketers and marketing agencies. It features hundreds of marketing data connections that can be set up in seconds. You just need to sign up, connect to the channels you're using, and start analyzing data.
The reports from TapClicks are easily shareable and can be set to auto-send on specific days. Its workflow lets you create business hierarchies in the platform and automate the delegation of tasks to specific employees.
TapClicks works well with both small businesses and large enterprises. It features an intuitive design that helps end-users make better business decisions for marketing performance optimizations.
Want to make the most of your marketing data queries? Try TapClicks today and see how it can improve your reporting and analytics.
What Is Domo?
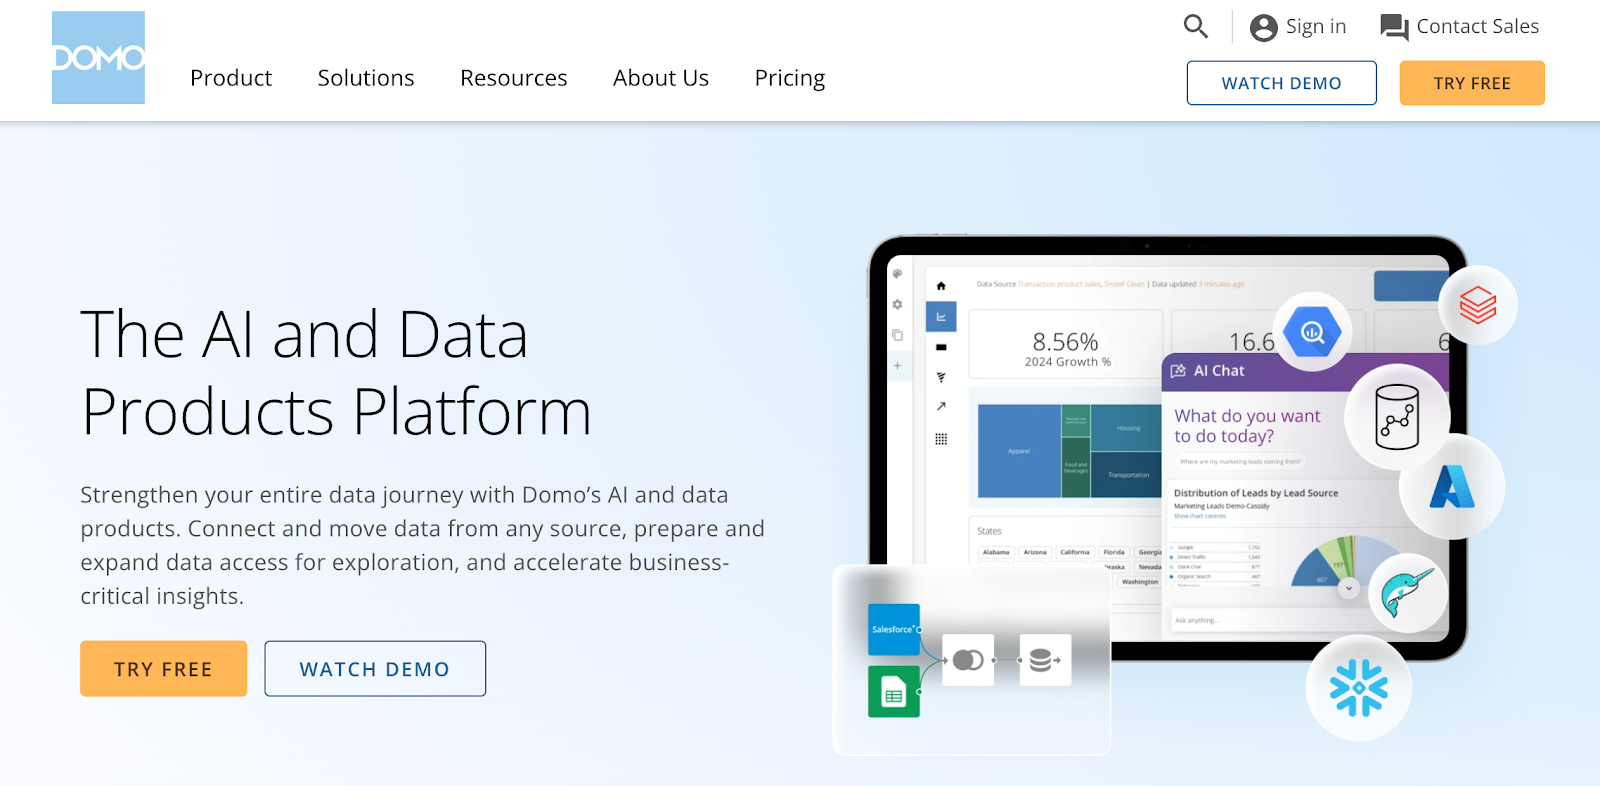
Source: Domo.com
Domo is a fully mobile, cloud-based system that takes all aspects of your business and makes it manageable from your iPhone. Designed to be mobile-first (for both iOS and Android devices), Domo works with your raw data to create data visualizations and support real-time collaboration in the platform.
Domo isn't set up with a marketer's mindset. Because of that, it doesn't carry some of the key features that make TapClicks advantageous to agencies. These include:
-
Factoring in margins and markups in reporting
-
Coming with hundreds of marketing connectors
-
Allowing custom-made channels for advertising and marketing packages for your clients
What Is Looker?
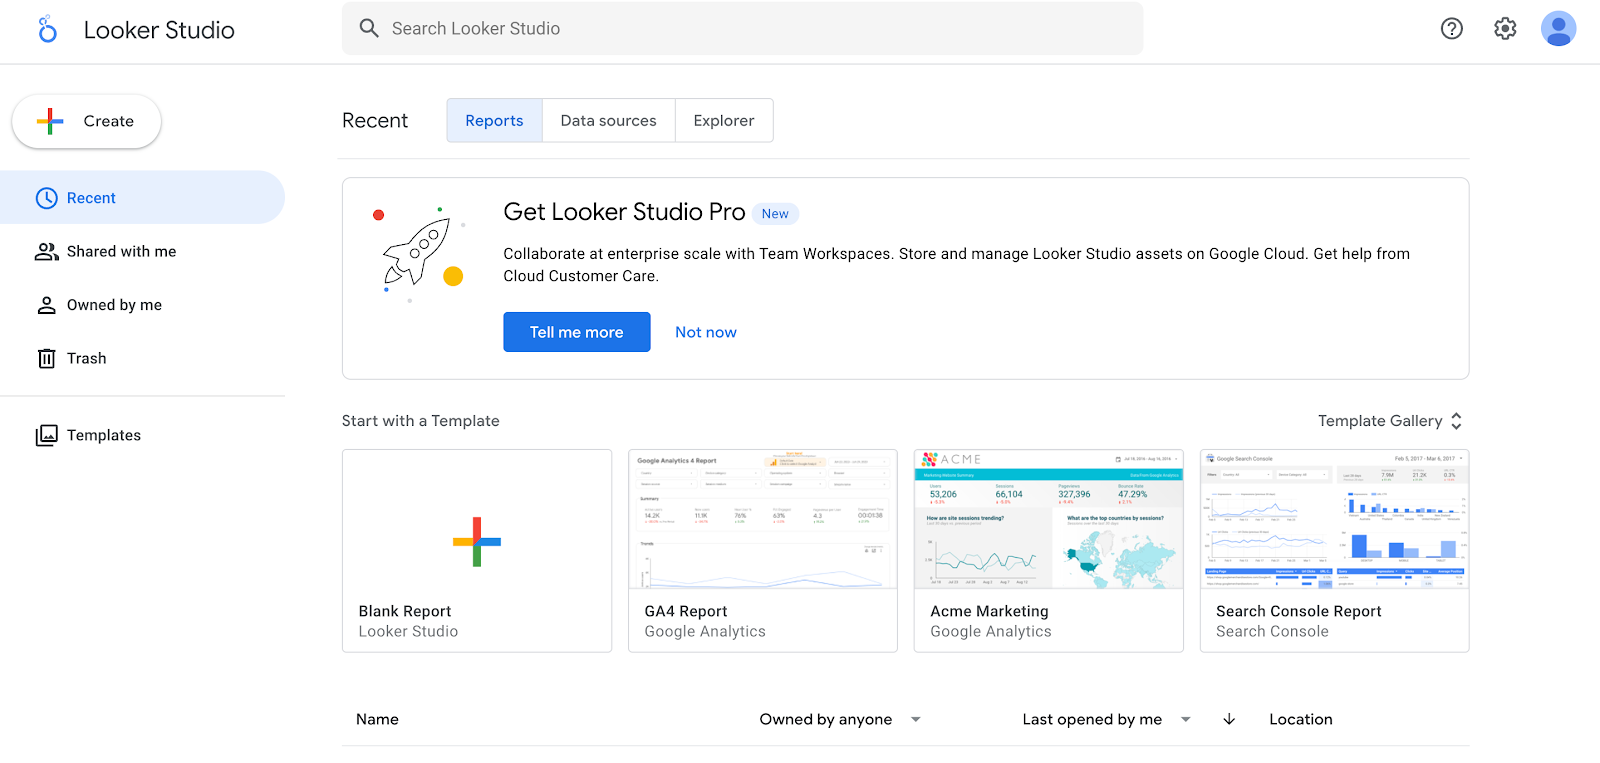
Source: Google.com
Looker is business intelligence software and big data analytics platform. Unlike Domo and TapClicks, Looker relies on LookML. This is a modeling language for data relationships in an SQL database.
There are pros and cons to LookML. Looker lends itself to advanced analytics, which helps organizations extract the query logic behind their analyses. The platform can transform data so your analytics are easier to manage and thus scalable.
However, these extra features might end up making Looker too labor-intensive, which can make it the wrong fit for your marketing agency.
When considering Looker, ask if your focus is client retention, developing and analyzing marketing strategies, and streamlined workflow. Note that these are not necessarily Looker's strengths. Looker is more suited for deep data analysis, business intelligence, and scalability of processes.
Benefits of Using TapClicks
TapClicks's platform can be segmented into four components: TapOrders, TapAnalytics, TapReports, and TapWorkflow. While separate, each component works together to create a cohesive performance management tool. Marketing agencies can use it to centralize data, show results, and influence the next steps in your marketing strategy.
Recommended Reading
How TapFree Transforms the Marketing Reporting Process
TapOrders
TapOrders automates your order (campaign) entries. This means you can create orders that show your customers' specific purchases. Similarly, you can let sales teams see which services are underperforming.
If using a CRM system like Salesforce, it's easy to set it up so data is imported from Salesforce into TapOrders.
Another plus is that TapOrders can integrate into your current billing system. You can also use TapOrders as your billing system interface. It allows you to create a margin-focused product catalog, which is great for agencies looking to upsell services.
TapAnalytics
TapAnalytics lets you easily view all your marketing campaigns and analyze their performance through a unified dashboard. If needed, you can import data from existing spreadsheets to help visualize data you may have stored off-site.
Think of TapAnalytics as a strategic advisor to your existing strategies. This means you can use your client's unified data to notice spikes, anomalies, and overall trends.
Through TapAnalytics, TapClicks makes it easy (and quick) to respond to key wins and losses. You can also set early warning signals to alert your team. The tool also allows you to:
-
Create custom dashboards: This is only available in the Elite packaging. If you're ready to consider pricing and options, jump to our section on pricing overview.
-
Set up calculations and custom metrics: Not every business is chasing the same metric. TapClicks lets you create calculations and custom metrics to cater to your client's needs.
-
Segment data into a specific channel: This is a great feature for regional areas within a larger company or specific areas within the same business.
-
Recreate the hierarchy of your business: Since TapClicks can grow with your agency, you can scale up to virtually unlimited users. You can then create specific roles and structures that match how you run your business day-to-day.
TapReports
TapReports helps you take your work and the results you achieved and share it with your team and clients. You can export reports to your clients through email, Word, Excel, PPTX, or PDF.
Through TapReports, data becomes more visually engaging and more revealing. It's easier to see opportunities when they aren't confined to rows and columns on a spreadsheet but presented in graphs, pie charts, and other engaging visuals.
You can schedule recurring reports and designate who you want to receive them. You can also set alerts for early warning signals to spot if a certain metric goes too low or a particular cost goes too high.
Additional TapReports features include:
Factor in Markup and Margins
Add your service charge to client campaigns without the awkward conversation. This gives you the flexibility to change costs per client and per service. In the end, your clients only see the final cost to them in their dashboards.
Channel Customization
Use channels to group marketing tools and combine data. For example, say your agency is using both Google Adwords and Bing Ads. However, you want to show your client their overall combined performance.
Simply combine data from both tools into one custom channel, where the metrics from both tools are streamlined. You can even take this feature a step further and create custom channels that reflect the mix of services/advertising packages your agency offers.
White-Label Reporting
You can create custom-branded reports with your logo and unique metrics. This maintains brand identity while helping your clients associate your marketing strategies with your agency.
TapWorkflow
TapWorkflow is the final piece of the TapClicks performance management platform. It automates a significant part of your day-to-day manual tasks so you can focus more on creative solutions and less on writing emails and holding meetings. TapWorkflow does this by automatically routing tasks based on established business processes.
Say there is a dip in click-through rates on a Facebook Ad campaign. TapWorkflow designates the task to your designated point person running Facebook Ads. This is much easier than looking at the data, interpreting it, and sending a message addressing the drop in percentage.
In TapWorkflow, you can also:
-
Log your hours: Keep track of your hours, whether for internal benchmarking or sending billable hour reports to your clients.
-
Minimize double work: Clear the headache of checking Slack, Trello, and last week’s email thread to be reminded of the new strategy. Use notes in TapWorkflow to have consistent, up-to-date information (with an audit trail so you can view changes).
Turn Marketing Data into Action with TapClicks. Get started with TapClicks today—book a demo now!
Benefits of Using Domo
Domo helps companies unify data, create visual layouts, and more. However, Domo is more labor-intensive than TapClicks but not as labor-intensive as Looker.
Domo has 1,000+ pre-built connectors, including Facebook Ads, Salesforce, Google Drive, Google Analytics, and JSON. These help you integrate your diverse list of data sources. Plus, you can bring in data from your on-premises systems, flat files, or your company's proprietary systems.
A feature unique to Domo is its bi-directional data, where Domo serves as the hub between two systems instead of an endpoint for data. However, this may not be the most useful to your agency if your focus is on presenting data to clients. Bi-directional data is also not applicable when using data science to improve client retention and monitor marketing campaign performance.
With Domo, you can also:
-
Use apps that are unique to your business needs. You can either build your apps (with your dev team) or work with Domo to build custom apps based on your data.
-
Present your data in Cards (on your dashboard) with a drag-and-drop interface. To create a Card, choose a source of data, such as sales metrics found in an Excel file on your desktop. Domo recommends visualizations based on your imported data, but this can be switched to your preference.
-
Use Domo Buzz. You can collaborate directly in Domo and minimize cross-platform chatter.
-
Ask Domo questions in natural language. Domo comes with natural language processing capabilities to give responses based on your data.
-
Utilize artificial intelligence. These include machine learning and predictive analytics to get more advanced analysis and make strategic business decisions.
Benefits of Using Looker
Depending on your needs as an agency, Looker may increase your insights into data. On the other hand, it may be a bit of an overkill and cause you to drain labor hours on back-end upkeep.
Looker is a data-discovery platform that relies on LookML, Looker's proprietary modeling language. It helps describe dimensions, aggregates, calculations, and data relationships in a SQL database.
The platform takes your raw marketing data and runs it through any SQL database. From there, LookML is applied to the data and transforms it into a tool that can be used and manipulated to create data visualizations.
The focus of Looker seems to be on the first part of this process—applying LookML to raw data run through an SQL database. From there, employees can use the information to perform intricate and involved data analysis.
If choosing Looker, make sure your agency has IT support or a team of dedicated data analysts who can manage your platform. Otherwise, you won't get the results you need.
With a dedicated team of analysts, your agency can use Looker to build multi-layered analytics for a client. Your marketing specialist can then create customized reports as necessary.
With Looker, you can:
-
Connect to 50+ SQL databases: These include Redshift, Snowflake, Amazon Athena, and Microsoft Azure SQL Data Warehouse.
-
Utilize row-level detail: You can drill through charts and gain a deeper understanding of your business.
-
Use filters to let your employees see a dashboard pertinent to their role: Your customer service managers and your sales rep can look at the data relevant to their role.
-
Develop any visualization using JavaScript: You can create custom visualizations based on your unique business.
Why struggle with tools that aren’t built for integrated marketing? Try TapClicks today—book a demo and start your free trial!
TapClicks vs Domo vs Looker: Feature Comparison
Choosing between TapClicks, Domo, and Looker depends on business needs, data integration, and reporting preferences.
While all three business intelligence tools offer unique features, they cater to different users. TapClicks is built for marketing teams, Domo is designed for business users, and Looker is ideal for data analysts and SQL-driven teams.
|
Feature |
TapClicks |
Domo |
Looker |
|
Best For |
Marketing teams, agencies, and media companies |
Business users who need real-time insights |
Data analysts and teams that require SQL-based data modeling |
|
Data Sources |
250+ ready built API integrations and 10k+ data connections with our SmartConnector |
1,000+ sources, including CRM, finance, and business data |
SQL-based, integrates with databases like BigQuery, Snowflake, and Redshift |
|
Ease of Use |
Pre-built marketing dashboards, no coding required plus AI driven analytics |
A drag-and-drop interface, AI-driven reports |
Requires SQL knowledge, best for technical users |
|
Create Custom Dashboards |
Yes, it is optimized for marketing analytics |
Yes, AI-powered dashboard creation |
Yes, but requires LookML for setup |
|
Personalized Data Permissions |
Yes, controls access based on clients and teams |
Yes, role-based access for business users |
Yes, advanced row and column-level access control |
|
AI and Predictive Analytics |
AI-powered insights for marketing campaigns |
AI-driven data visualizations and trend detection |
Requires external machine learning models for AI insights |
|
Automated Reporting |
Yes, scheduled reports for marketing teams and agencies |
Yes, auto-refreshing reports |
Yes, customizable reports but require SQL queries |
|
Embedded Analytics |
Yes, white-label dashboards for client reporting |
Yes, it allows external dashboard sharing |
Yes, it supports embedding within apps and websites |
|
Pricing |
Starts at $99/month (TapData Plan) |
Subscription-based pricing varies by data volume |
Custom pricing varies by users and data processing needs |
For businesses focused on marketing analytics and campaign performance tracking, TapClicks is the best choice due to its pre-built marketing dashboards, automated client reports, and easy integrations with ad platforms.
Domo vs. Looker vs. TapClicks: Pricing
All three tools come with their respective plans and pricing. Each platform offers scalable options designed to fit different business sizes and needs. Pricing structures often depend on the number of users, the features included, and the level of customization required.
TapClicks Pricing and Available Plans
TapClicks offers their services in packages, as well as segmented by need.
-
250+ connections plus SmartConnector, analytics, and interactive dashboards starting at $1,200.
To get a quote for any of these services, you can reach out to TapClicks directly.
Domo Pricing and Available Plans
Domo pricing tiers are not publicly available on their website.
Looker Pricing and Available Plans
Looker does not provide readily available public pricing.
Why TapClicks Is the Best Choice
TapClicks is the best business intelligence software for marketing teams and agencies that need automated reporting and campaign tracking. Unlike Domo and Looker, which focus on general business intelligence, TapClicks is designed for advertising performance analytics with 250+ marketing integrations, pre-built dashboards, and AI-driven insights.
With automated reports, white-label dashboards, and personalized data permissions, businesses can track ad spend, ROI, and campaign success without manual work. Agencies handling multiple clients and campaigns get a simple, efficient reporting solution.
For marketing professionals looking for real-time insights and better data management, TapClicks delivers a complete marketing analytics platform.
Ready to simplify your marketing analytics? Book a demo and start your 14-day trial today!
FAQs About Domo vs Looker
Is Domo a data visualization tool?
Yes, Domo is a business intelligence platform that includes data visualization tools. It allows users to create custom dashboards and analyze real-time data from multiple sources without coding.
What are the disadvantages of Looker?
Looker requires SQL knowledge, making it difficult for non-technical users. It also has custom pricing, which can be costly for smaller businesses. Some users find that reporting setup takes longer compared to other BI tools.
Is Domo like Tableau?
Domo and Tableau both provide data visualization and business intelligence, but they differ in approach. Domo offers AI-driven insights and real-time dashboards, while Tableau focuses on deep customization and interactive reports.
What is the Microsoft equivalent of Looker?
Microsoft Power BI is the closest alternative to Looker. It provides data modeling, interactive dashboards, and deep integration with Microsoft tools like Azure and Excel.
Which is better for marketing analytics: Domo, Looker, or TapClicks?
TapClicks is the best option for marketing analytics because it offers pre-built marketing dashboards, automated reports, and AI-driven campaign insights. Domo and Looker focus more on general business intelligence and data modeling.
.png)